4QFY2018 Result Update | Plywood
May 31, 2018
Greenply Industries Ltd
BUY
CMP
`256
Performance Update
Target Price
`364
4QFY18
4QFY17
% chg. (yoy)
3QFY18
% chg. (qoq)
Investment Period
12 Months
Net Sales
437
478
(8.6)
399
9.5
Stock Info
Operating profit
57
73
(22.2)
63
(8.9)
Sector
Plywood
Market Cap (` cr)
4,155
OPM (%)
13.1
15.3
(228)
15.7
(263)
Net Debt (` cr)
413
Adj. PAT
33
42
(22)
36
(10)
Beta
1.0
52 Week High / Low
845/587
Source: Company, Angel Research
Avg. Daily Volume
57,987
Face Value (`)
1
For 4QFY2018, Greenply Industries disappointed both on the top-line as well as
BSE Sensex
33,812
Nifty
10,442
on the bottom-line front. Revenue de-grew by ~8.6% yoy to `437cr on an
Reuters Code
GRPL.BO
Bloomberg Code
MTLM.IN
account of poor performance in Plywood segment as well as in MDF segment. On
Shareholding Pattern (%)
the operating front, margins contracted by
228bps due to due to lower
Promoters
51.0
MF / Banks / Indian Fls
20.6
realisations in Plywood and losses in Wallpaper and others category. During the
FII / NRIs / OCBs
14.9
Indian Public / Others
13.5
quarter, PAT de-grew by ~22% yoy to `33cr on account of lower revenue and
Abs.(%)
3m
1yr
3yr
Sensex
7.4
27.1
22.9
poor operating margin.
Blue Star
(23.8)
(0.2)
33.9
Overall top-line subdued: The Company’s top-line de-grew by ~8.6% yoy to
`437cr on an account of poor performance in Plywood segment as well as in
MDF segment. Plywood segment de-grew by ~9.1% yoy during the quarter,
whereas MDF segment reported a decline of ~12.4% yoy. The Company’s other
segment also de-grew by ~63.4% yoy.
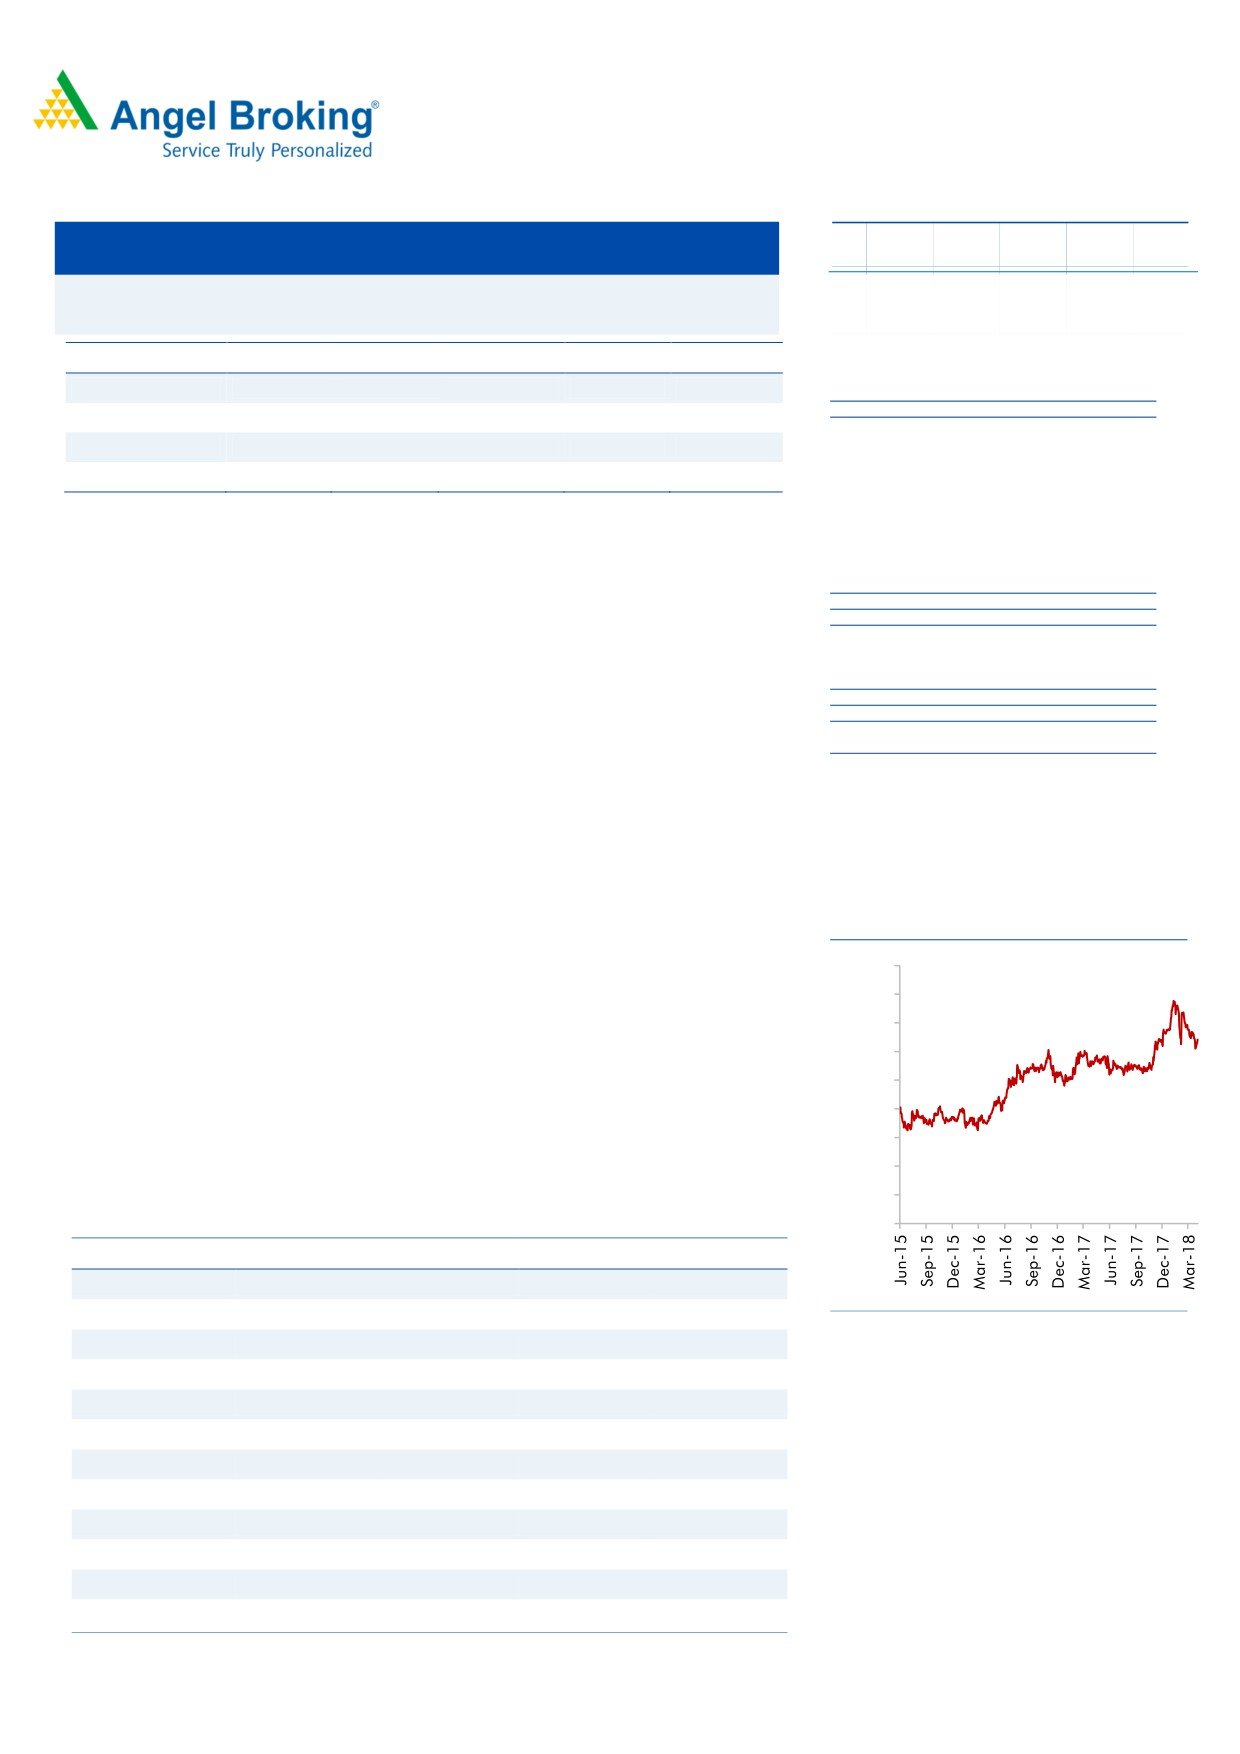
3-year price chart
Lower revenue and poor operating performance drag the overall profitability: On
the operating front, the company’s margin contracted by 228bps yoy due to lower
450
realisations in Plywood and losses in Wallpaper and others category. On the
400
bottom-line front, PAT de-grew by ~22% yoy to `33cr on an account of lower
350
revenue and poor operating margin.
300
250
Outlook & Valuation: We forecast GIL to report top-line CAGR of ~15% to
200
`2,256cr over FY18-20E on the back of strong brand and distribution network. On
150
the bottom-line front, we estimate ~12% CAGR to `139cr owing to improvement
100
in volumes. We recommend Buy with a revised target price of `364.
50
Key Financials
0
Y/E March (`cr)
FY2017
FY2018
FY2019E
FY2020E
Net Sales
1,664
1,713
1,938
2,256
% chg
1.0
3.0
13.1
16.4
Source: Company, Angel Research
Net Profit
125
111
120
140
% chg
(1.9)
(11.8)
8.8
16.0
OPM (%)
14.5
13.5
13.6
13.8
EPS (Rs)
10.2
9.0
9.8
11.4
P/E (x)
33.2
37.7
34.6
29.9
P/BV (x)
5.4
4.7
4.2
3.6
Amarjeet S Maurya
RoE (%)
16.2
12.5
12.0
12.2
022-39357800 Ext: 6831
RoCE (%)
16.3
11.6
11.5
11.8
EV/Sales (x)
2.7
2.8
2.5
2.1
EV/EBITDA (x)
18.5
20.8
18.2
15.3
Source: Company, Angel Research Note: CMP as of May 31,2018
Please refer to important disclosures at the end of this report
1
Greenply Industries Ltd | 4QFY2018 Result Update
Exhibit 1: 4QFY2018 Performance
Y/E March (` cr)
4QFY18
4QFY17
% chg. (yoy)
3QFY18
% chg. (qoq)
FY2018
FY2017
% chg
Net Sales
437
478
(8.6)
399
9.5
1,704
1,777
(4.1)
Net raw material
232.0
232
(0.2)
213
9.1
884.1
879.7168
0.5
(% of Sales)
53.1
48.6
448
53.3
(19)
51.9
49.5
Employee Cost
42
43
(1.8)
49
(14.9)
185
171
8.5
(% of Sales)
9.6
8.9
67
12.3
(274)
10.9
9.6
Other Expenses
106
130
(18.3)
75
41.9
395
473
(16.5)
(% of Sales)
24.3
27.2
(287)
18.7
556
23.2
26.6
Total Expenditure
380
405
(6.2)
337
12.9
1,464
1,524
(3.9)
Operating Profit
57
73
(22.2)
63
(8.9)
240
253
(5)
OPM (%)
13.1
15.3
(228)
15.7
(263)
14.07
14.25
(18)
Interest
1
2
(37.1)
3
(47.9)
9
18
(47.7)
Depreciation
11
12
(7.6)
10
6.7
45
49
(7.7)
Other Income
1
1
(14.3)
1
24.3
4
4
(13.5)
PBT
46
61
(24.4)
51
(9.4)
189
191
(0.9)
(% of Sales)
10.5
12.7
12.7
11.1
10.7
Tax
13
19
(29.5)
15
(9.2)
54
56
(4.2)
(% of PBT)
28.9
31.0
28.8
28.3
29.3
Reported PAT
33
42
(22.1)
36
(9.5)
136
135
0.5
PATM
7.5
8.8
9.0
8.0
7.6
Adj PAT
33
42
(22.1)
36
(9.5)
136
135
0.5
Source: Company, Angel Research
May 31, 2018
2
Greenply Industries Ltd | 4QFY2018 Result Update
Outlook & Valuation: We forecast GIL to report top-line CAGR of ~15% to
`2,256cr over FY18-20E on the back of strong brand and distribution network. On
the bottom-line front, we estimate ~12% CAGR to `139cr owing to improvement
in volumes. We maintain our Buy recommendation with a target price of `364.
Downside risks to our estimates
Most of the company’s raw material is imported from other countries. The
company also has ECB loan, hence any unfavorable change in currency may
pose forex risks, which could significantly impact GIL’s margins.
The company is expanding the MDF plant with capex of ~`700cr, any
slowdown in MDF market can impact the company’s earnings due higher fixed
cost overheads.
Company Background
Greenply Industries Limited is engaged in the business of manufacturing plywood
& allied products and medium density fibreboards (MDF) through its factories at
various locations. The company's segments include Plywood & Allied Products and
Medium Density Fibre Boards & Allied Products. The Plywood & Allied Products
segment is engaged in the business of manufacturing and trading of Plywood,
block boards, veneer, doors and other wood panel products through its wholesale
and retail network. The Medium Density Fibre Boards & Allied Products segment is
engaged in the business of manufacturing of Medium Density Fibreboards and
other allied products through its wholesale and retail network. The company offers
a portfolio of residential and commercial products comprising plywood and block
boards, MDF, wood floors, flush doors and decorative veneers. The company
offers wood floors under the brand name Green Floormax.Electronics.
May 31, 2018
3
Greenply Industries Ltd | 4QFY2018 Result Update
Consolidated Profit & Loss Statement
Y/E March (` cr)
FY2017
FY2018
FY2019E
FY2020E
Total operating income
1,664
1,713
1,938
2,256
% chg
1.0
3.0
13.1
16.4
Total Expenditure
1,423
1,482
1,674
1,945
Raw Material
883
895
1,013
1,180
Personnel
177
197
225
264
Others Expenses
362
390
436
501
EBITDA
241
231
264
311
% chg
0.9
(4.2)
14.2
18.2
(% of Net Sales)
14.5
13.5
13.6
13.8
Depreciation& Amortisation
51
50
64
83
EBIT
190
181
200
228
% chg
0.6
(4.9)
10.4
14.2
(% of Net Sales)
11.4
10.6
10.3
10.1
Interest & other Charges
19
11
35
38
Other Income
10
2
10
12
(% of PBT)
5.5
1.3
5.7
5.9
Share in profit of Associates
-
-
-
-
Recurring PBT
181
172
174
202
% chg
6.9
(5.3)
1.6
16.0
Tax
56
54
54
63
(% of PBT)
30.8
31.2
31.0
31.0
PAT (reported)
125
118
120
140
% chg
(1.9)
(11.8)
8.8
16.0
(% of Net Sales)
7.5
6.5
6.2
6.2
Basic EPS (`)
10.2
9.0
9.8
11.4
Fully Diluted EPS (Rs)
10.2
9.0
9.8
11.4
% chg
(1.9)
(11.8)
8.8
16.0
May 31, 2018
4
Greenply Industries Ltd | 4QFY2018 Result Update
Consolidated Balance Sheet
Y/E March (` cr)
FY2017
FY2018
FY2019E
FY2020E
SOURCES OF FUNDS
Equity Share Capital
12
12
12
12
Reserves& Surplus
760
871
991
1,131
Shareholders Funds
773
883
1,004
1,143
Minority Interest
-
-
-
-
Total Loans
397
682
732
782
Deferred Tax Liability
49
49
49
49
Total Liabilities
1,218
1,614
1,785
1,974
APPLICATION OF FUNDS
Gross Block
797
807
1,507
1,517
Less: Acc. Depreciation
272
321
385
468
Net Block
526
486
1,122
1,049
Capital Work-in-Progress
269
620
-
-
Investments
26
26
26
26
Current Assets
757
865
1,071
1,385
Inventories
158
215
255
297
Sundry Debtors
302
319
372
451
Cash
78
33
77
163
Loans & Advances
66
127
155
203
Other Assets
153
171
213
271
Current liabilities
395
410
462
513
Net Current Assets
363
455
609
872
Deferred Tax Asset
35
35
35
35
Mis. Exp. not written off
-
-
-
-
Total Assets
1,218
1,614
1,785
1,974
May 31, 2018
5
Greenply Industries Ltd | 4QFY2018 Result Update
Consolidated Cash flow Statement
Y/E March (`cr)
FY2017
FY2018
FY2019E FY2020E
Profit before tax
181
172
174
202
Depreciation
51
50
64
83
Change in Working Capital
(25)
(137)
(110)
(177)
Interest / Dividend (Net)
18
11
35
38
Direct taxes paid
(42)
(54)
(54)
(63)
Others
(0)
0
0
0
Cash Flow from Operations
183
42
109
84
(Inc.)/ Dec. in Fixed Assets
(295)
(10)
0
(10)
(Inc.)/ Dec. in Investments
2
(345)
(80)
0
Cash Flow from Investing
(293)
(355)
(80)
(10)
Issue of Equity
50
0
0
0
Inc./(Dec.) in loans
129
285
50
50
Dividend Paid (Incl. Tax)
(7)
0
0
0
Interest / Dividend (Net)
(22)
(11)
(35)
(38)
Cash Flow from Financing
150
274
15
12
Inc./(Dec.) in Cash
40
(38)
44
86
Opening Cash balances
31
71
33
77
Closing Cash balances
71
33
77
163
May 31, 2018
6
Greenply Industries Ltd | 4QFY2018 Result Update
Key Ratios
Y/E March
FY2017
FY2018
FY2019E
FY2020E
Valuation Ratio (x)
P/E (on FDEPS)
33.2
37.7
34.6
29.9
P/CEPS
23.7
24.8
22.7
18.7
P/BV
5.4
4.7
4.2
3.6
Dividend yield (%)
20.6
0.0
0.0
0.0
EV/Sales
2.7
2.8
2.5
2.1
EV/EBITDA
18.5
20.8
18.2
15.3
EV / Total Assets
3.7
3.0
2.7
2.4
Per Share Data (`)
EPS (Basic)
10.2
9.0
9.8
11.4
EPS (fully diluted)
10.2
9.0
9.8
11.4
Cash EPS
14.4
13.7
15.0
18.2
DPS
70.0
0.0
0.0
0.0
Book Value
63.0
72.0
81.9
93.2
Returns (%)
ROCE
16.3
11.6
11.5
11.8
Angel ROIC (Pre-tax)
17.9
12.0
12.2
13.1
ROE
16.2
12.5
12.0
12.2
Turnover ratios (x)
Asset Turnover (Gross Block)
2.1
2.1
1.3
1.5
Inventory / Sales (days)
35
46
48
48
Receivables (days)
66
68
70
73
Payables (days)
66
66
66
64
Working capital cycle (ex-cash) (days)
35
48
52
57
Source: Company, Angel Research
May 31, 2018
7
Greenply Industries Ltd | 4QFY2018 Result Update
Research Team Tel: 022 - 39357800
Website:
DISCLAIMER
This document is solely for the personal information of the recipient, and must not be singularly used as the basis of any
investment decision. Nothing in this document should be construed as investment or financial advice. Each recipient of
this document should make such investigations as they deem necessary to arrive at an independent evaluation of an
investment in the securities of the companies referred to in this document (including the merits and risks involved), and
should consult their own advisors to determine the merits and risks of such an investment.
Angel Broking Pvt. Limited, its affiliates, directors, its proprietary trading and investment businesses may, from time to
time, make investment decisions that are inconsistent with or contradictory to the recommendations expressed herein. The
views contained in this document are those of the analyst, and the company may or may not subscribe to all the views
expressed within.
Reports based on technical and derivative analysis center on studying charts of a stock's price movement, outstanding
positions and trading volume, as opposed to focusing on a company's fundamentals and, as such, may not match with a
report on a company's fundamentals.
The information in this document has been printed on the basis of publicly available information, internal data and other
reliable sources believed to be true, but we do not represent that it is accurate or complete and it should not be relied on
as such, as this document is for general guidance only. Angel Broking Pvt. Limited or any of its affiliates/ group
companies shall not be in any way responsible for any loss or damage that may arise to any person from any inadvertent
error in the information contained in this report. Angel Broking Pvt. Limited has not independently verified all the
information contained within this document. Accordingly, we cannot testify, nor make any representation or warranty,
express or implied, to the accuracy, contents or data contained within this document. While Angel Broking Pvt. Limited
endeavours to update on a reasonable basis the information discussed in this material, there may be regulatory,
compliance, or other reasons that prevent us from doing so.
This document is being supplied to you solely for your information, and its contents, information or data may not be
reproduced, redistributed or passed on, directly or indirectly.
Angel Broking Pvt. Limited and its affiliates may seek to provide or have engaged in providing corporate finance,
investment banking or other advisory services in a merger or specific transaction to the companies referred to in this
report, as on the date of this report or in the past.
Neither Angel Broking Pvt. Limited, nor its directors, employees or affiliates shall be liable for any loss or damage that
may arise from or in connection with the use of this information.
Note: Please refer to the important `Stock Holding Disclosure' report on the Angel website (Research Section). Also,
please refer to the latest update on respective stocks for the disclosure status in respect of those stocks. Angel Broking Pvt.
Limited and its affiliates may have investment positions in the stocks recommended in this report.
Disclosure of Interest Statement Nilkamal
1. Analyst ownership of the stock No
2. Angel and its Group companies ownership of the stock No
3. Angel and its Group companies' Directors ownership of the stock
No
4. Broking relationship with company covered
No
Note: We have not considered any Exposure below ` 1 lakh for Angel, its Group companies and Directors
Ratings (Returns):
Buy (> 15%)
Accumulate (5% to 15%)
Neutral (-5 to 5%)
Reduce (-5% to -15%)
Sell (< -15%)
May 31, 2018
8